
Q4 Is Won in Q3: What 3.1 Million EDI Transactions Tell Us About Retail This Holiday Season
Every purchase order, invoice, advance ship notice and inventory update that moves between a supplier and a retailer leaves a record. Taken together, those records show what's really happening in the supply chain. They often show it weeks before sales figures do.
At eZCom Software, we looked at transaction volume across our 50 highest-volume customers for the first three quarters of 2026. They include brands in home furnishings, apparel, beauty, footwear, baby gear, toys, pet products, food and beverage, and more. Here's what the Q3 data shows.
Our view is simple: EDI isn't a back-office compliance cost. It's the earliest, most honest read on where retail is headed, and the suppliers who treat it as a growth system will win Q4. The Q3 numbers back that up.
1. Volume is up, even after the spring peak
Our top 50 customers ran 3.1 million transactions in Q3, for 9.4 million year to date. Q3 came in 4% above Q1 and 7% below Q2.
The Q2 peak was expected. Spring and early summer bring a surge in seasonal categories, and that rush passed in Q3. The better measure is the 37 brands that ranked in our top 50 in every quarter. Their combined volume grew 13.8% from Q1 to Q3.
The growth was widespread. Nearly two-thirds of those brands (24 of 37) did more volume in Q3 than in Q1. The median brand grew 22%.
Our take: Don't read the dip from Q2 to Q3 as a slowdown. It's the calendar. Compare the same brands over time and the trend is clearly up. Suppliers who panic over one quarter's swing tend to cut back right before demand returns.
2. Holiday prep shows up in Q3
If you want to know when holiday season really starts for suppliers, look at the transactions. Among brands active in both quarters, volume from Q2 to Q3 rose:
- 25% in Toys & Games
- 20% in Pet Products
- 7% in Baby Products
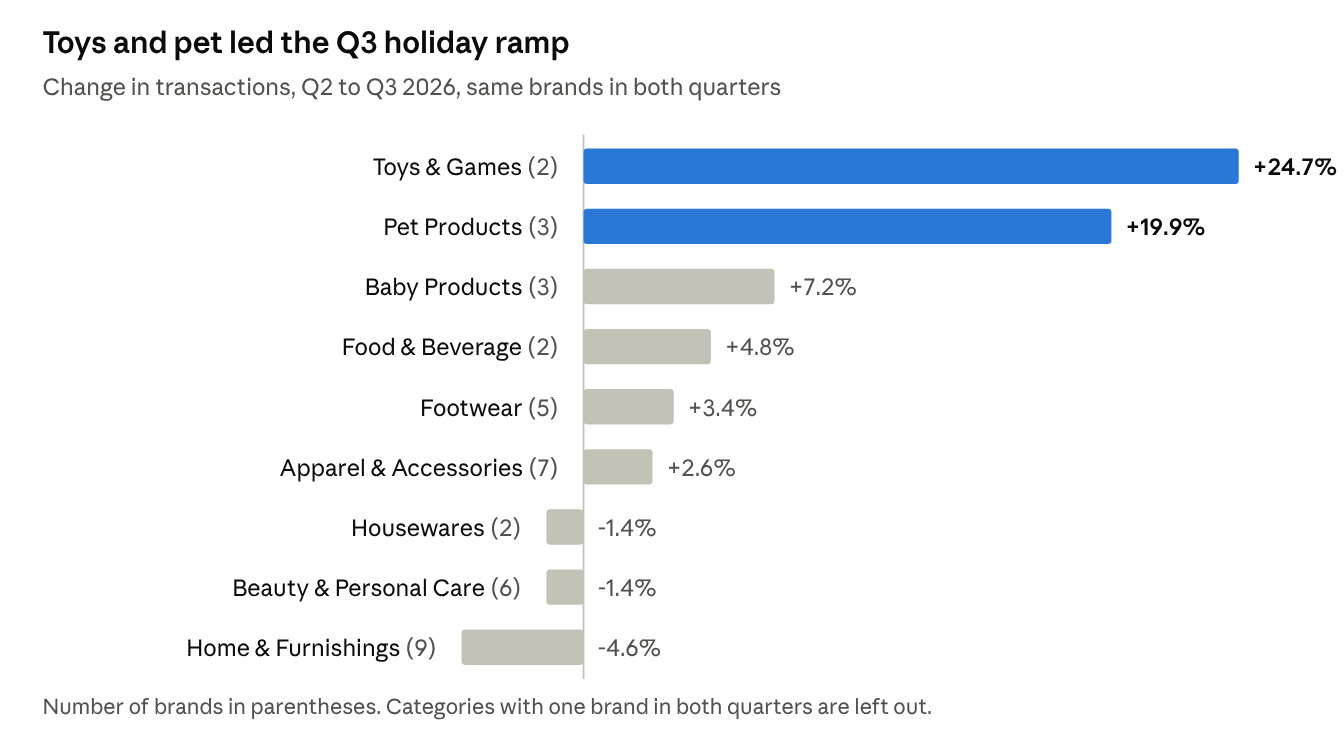
These are the categories retailers stock up on before Q4 gift-giving. The orders, confirmations and ship notices behind those shelves are already moving through EDI in July, August and September.
The flip side is just as clear. Lawn & Garden volume fell 26% from its Q2 high, and Consumer Electronics fell 58% after a strong second quarter. For suppliers in seasonal categories, the lesson is simple: your EDI setup has to handle big swings, not just steady volume.
Our take: The real holiday deadline for suppliers isn't Black Friday. It's Labor Day. If your retailer connections, ship notices and inventory feeds haven't been tested at peak volume by early September, you're already behind. We'd rather see a supplier find a mapping error in August than in a chargeback in December.
3. Smaller brands are scaling fast
Six brands in our top 50 grew their transaction volume by 40% or more in a single quarter. They aren't all in one category. They include baby gear, toys, women's apparel, pet products and children's footwear.
Fast growth like this puts pressure on a supplier's operations. A brand that doubles its order flow in 90 days needs EDI that scales without adding headcount or manual work.
Our take: Growth breaks manual processes first. In our experience, the brands that scale smoothly are the ones that automated before they needed to. Waiting until order volume doubles to fix your EDI is like installing a sprinkler system during the fire.
4. The home still leads
Home furnishings and housewares made up 48% of all Q3 transaction volume in our top 50, nearly half. That includes bedding, mattresses, rugs, towels, kitchen tools and bakeware.
Home goods tend to involve large catalogs, many SKUs and frequent replenishment, which all generate high transaction counts. These brands depend on fast, accurate document exchange with their retail partners.
Our take: Home goods suppliers have been forced to get EDI right because their catalogs leave no room for error. Brands in other categories should borrow that playbook now, before their own SKU counts and retail partners catch up.
5. New categories are moving onto EDI
Five brands entered our top 50 in Q3, and four of them appeared for the first time this year. They come from jewelry, health & wellness, beverages and hair care. Health & wellness volume in the top 50 more than doubled from Q2 to Q3.
This matches a wider trend. As more retailers require EDI from every vendor, categories that once relied on email and spreadsheets are adopting it.
Our take: EDI is no longer just for the biggest brands. Retailers now expect it from everyone, and brands that wait to adopt it don't just lose efficiency. They lose shelf space to competitors who are easier to do business with.
6. Big brands grow, and so does the middle
Our 10 largest customers made up 63% of top-50 volume in Q3, up from 58% in Q1. But the middle grew too. The median top-50 account went from 30,748 transactions in Q1 to 33,112 in Q3, a 7.7% increase.
Our take: The headline will always go to the biggest players, but the steady rise of the middle is the more important signal. Mid-size brands are adding retailers and volume faster than ever. That's where we see the most opportunity, and the most risk for anyone still running on spreadsheets.
What this means for suppliers heading into Q4
- Plan for the peak now. Q3 volume in toys, pet and baby shows holiday demand is already here. Confirm your trading-partner maps, ship-notice timing and inventory feeds before Q4 volume arrives.
- Build for swings. Seasonal categories can rise or fall by a quarter or more between quarters. Your EDI solution should handle both without manual workarounds.
- Expect to grow. Two-thirds of our consistent top brands grew this year. Make sure your setup can take on new retailers and higher volume without rework.
Our bottom line
The Q3 data tells a confident story: suppliers are growing, new categories are joining, and holiday demand is arriving earlier every year. The brands that come out ahead won't be the ones with the most volume. They'll be the ones whose systems were ready before the volume showed up. At eZCom, that's the work we do every day, and Q3 tells us it matters more than ever.
Talk to Our TeamMethodology: This analysis covers EDI transaction counts for eZCom Software's 50 highest-volume customers in each quarter of 2026 (Q1: January–March; Q2: April–June; Q3: July–September). Growth comparisons by brand and category use only brands present in both periods compared. No customer names or revenue figures are disclosed.